The R code for this analysis is available here and the (completely fabricated) data is available here.
Background – Where Does Logistic Regression fit within Machine Learning?
Machine learning can be crudely separated into 2 branches:
- Supervised learning – we are training the model on a specific target variable. We are looking to identify the relationship between the target variable and potential predictor variables. Examples discussed in earlier blog posts include: random forests, loess and linear regression, naive Bayes
- Unsupervised learning – there is no target variable. We apply an algorithm to uncover relationships between variables in the data. Examples include: hierarchical clustering, k-means clustering, anomaly detection.
I had a graphic in A very brief introduction to statistics (slide 8) which highlighted the distinction within supervised learning between regression and classification. Here it is again.

Top of the list of classification algorithms on the left is good old “logistic regression” developed by David Cox in 1958. There is an inside joke in the data science world that goes something like this:
Data scientists love to try out many different kinds of models before eventually implementing logistic regression in production!
It’s funny cos it’s true! Well, kinda true. Logistic regression is popular because it is robust (in that it tends to give a pretty good answer even if the logistic regression assumptions are not strictly adhered to) and it is extremely simple to build in production (the end result is just a simple formula which is easy compared to the complex output of a neural net or a random forest). So you need to make a really strong case to justify moving away from the tried and trusted logistic regression approach.
Without further ado, let’s jump into an example!
Loan Application Example
Say we had the following loan application data. These loan applications have been reviewed and approved/denied by lending experts. As an experiment, your boss wants to develop a quick response loan process for small loan requests and she asks you to develop a model.

Correlation Analysis
In this data set it looks like Credit Score and Loan Amount are two useful variables that influence the outcome of a loan decision. Let’s run a quick analysis to see how they correlate with loan decisions.

Credit score has a positive correlation, 0.689, with loan decision – that makes sense – the higher your credit score, the greater your chances of being approved for a loan. But loan amount has a negative correlation, -0.500, with loan decision – this also makes sense – most banks will probably lend anyone 200 bucks without much fuss but if I ask for $50,000 that’s a different story!
Simple Model – One Predictor Variable
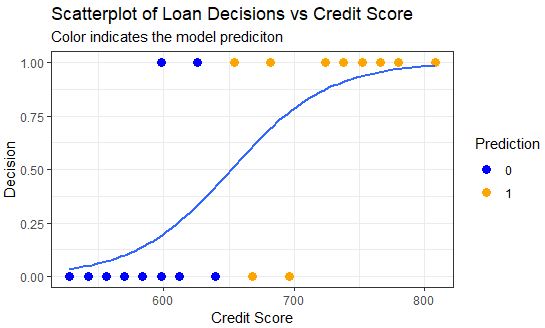
Credit score is most highly correlated with loan decision so let’s first build a logistic regression model using only credit score as a predictor.

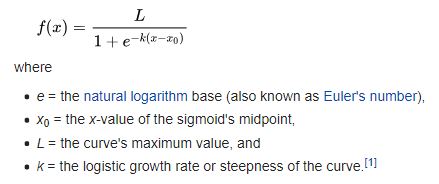
The equation of this curve takes the following form:
and the coefficients can be deduced from the logistic regression summary

where β0 = -17.51205 and β1 = 0.02687.
But perhaps a more intuitive way of writing the same function is as follows:

In our example: x0 = (-β0 / β1) = (-17.51205 / 0.02687) = 651.7, and L = 1.0, and k = 0.02687. I prefer this form of the equation because it more easily relates to the chart where we can clearly see that at a credit score of about 651.7 the probability of a loan being approved is precisely 0.5. If credit score was the only data you had and someone demanded a yes/no answer from you, then you could reduce the model to:
IF credit score ≥ 652 THEN approve ELSE deny
Of course it would be a shame to reduce the continuous output of the logistic regression to a binary output. Any savvy lender should be interested in the distinction between a 0.51 probability vs a 0.99 probability – perhaps someone with a high credit score gets a lower rate of interest and vice-versa rather than a crude approve/deny outcome.
Model Performance with One Predictor Variable
The performance of this model can be assessed by looking at the confusion matrix output and/or by coloring in the classifications on the chart.

The confusion matrix terms can be a little (ahem) confusing, it’s best not to get too bogged down with them as I discussed here but looking at the balanced accuracy is a decent rule-of-thumb.
In other domains you may want to pay more careful attention if there is a significant real cost difference between false positives and false negatives. For example, say you have a sophisticated device to detect land mines, the cost of a false negative is very high compared to the cost of a false positive.
On the chart below we can compare the classification results to the confusion matrix and confirm that the model does indeed have 2 false positives and 2 false negatives.

Slightly More Complex Model – Two Variables
Let’s now go back and include the second variable: Loan Amount. Remember Loan Amount had a negative correlation – the larger the loan amount, the lower the likelihood of approval.

Because we have an extra dimension in this chart, we use different shapes to indicate whether a loan was approved or denied. We can see there are still two false negatives but there is now only one false positive – so the model has improved! The balanced accuracy has increased from 0.80 to 0.85 – yaaay! 🙂
Visualizing the Logistic Regression Partition
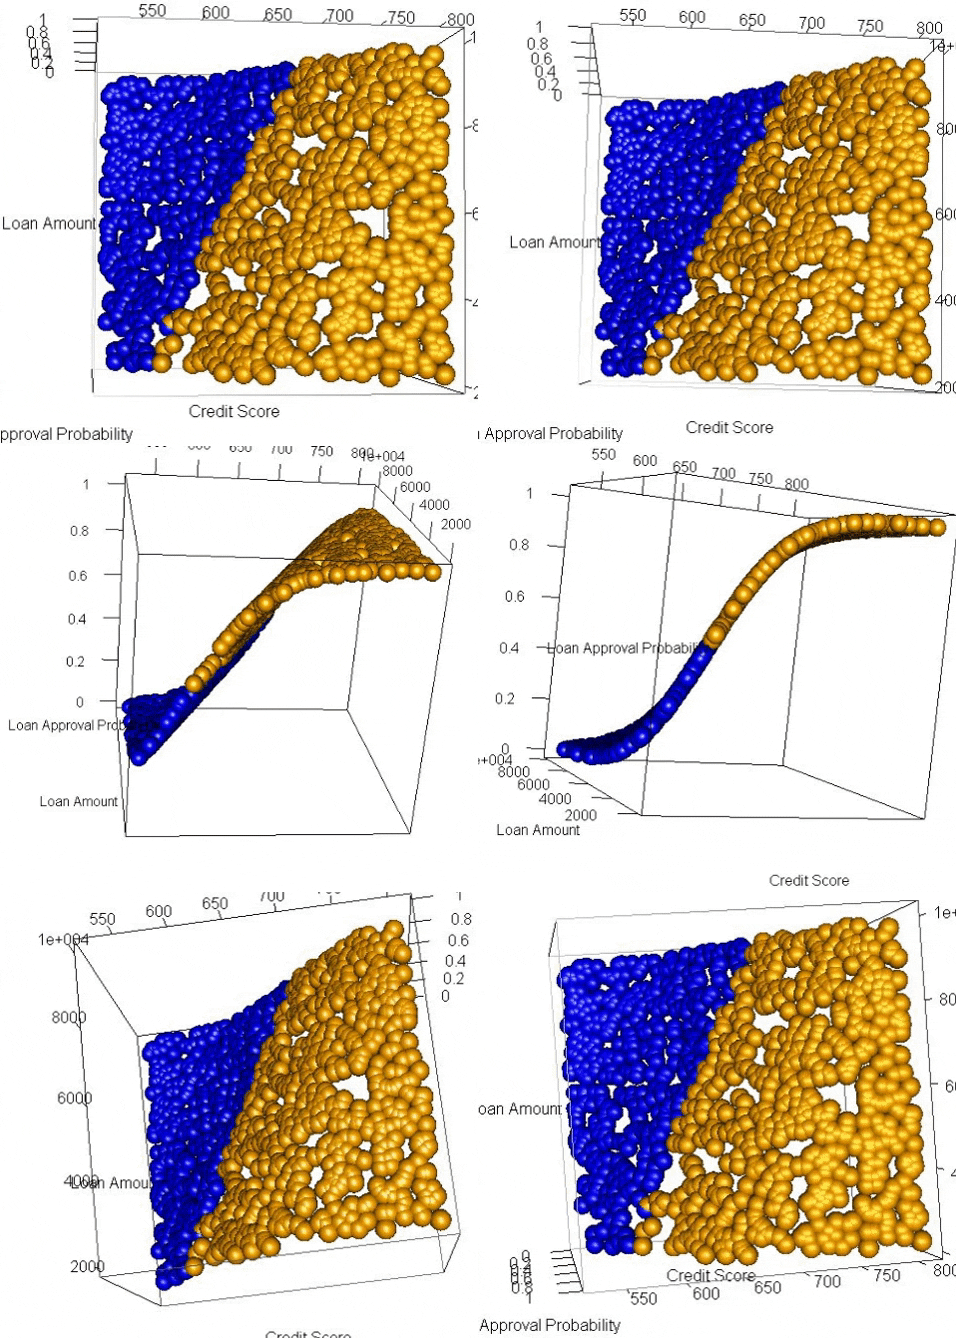
We can sorta make out the partition when we look at the chart above but with only 20 data points it’s not very clear. For a clearer visual of the partition we can flood the space with hundreds of dummy data points and produce a much clearer divide.

We used a continuous color scale here to show how the points close to the midpoint of the sigmoid curve have a less clear classification, i.e. the probability is around 0.5. But we still can’t really see the curve in this visual – we have to imagine the orange points in the bottom right are higher (probability) than the blue points in the top left and all of the points are sitting atop a sigmoidal plane and the inflection point of the sigmoid runs along the partition where prediction probability = 0.5.
Using a 3-dimensional plot we can clearly see the distinctive sigmoid curve slicing through the space.

It is important to note that you don’t need to generate any of these visualizations when doing logistic regression and when you have more than 2 variables it becomes very difficult to effectively visualize. However, I have found that going through an exercise like this helps me achieve a richer understanding of how a logistic regression works and what it does. The better we understand the tools we use, the better craftspeople we are.
The R code for this analysis is available here and the (completely fabricated) data is available here.